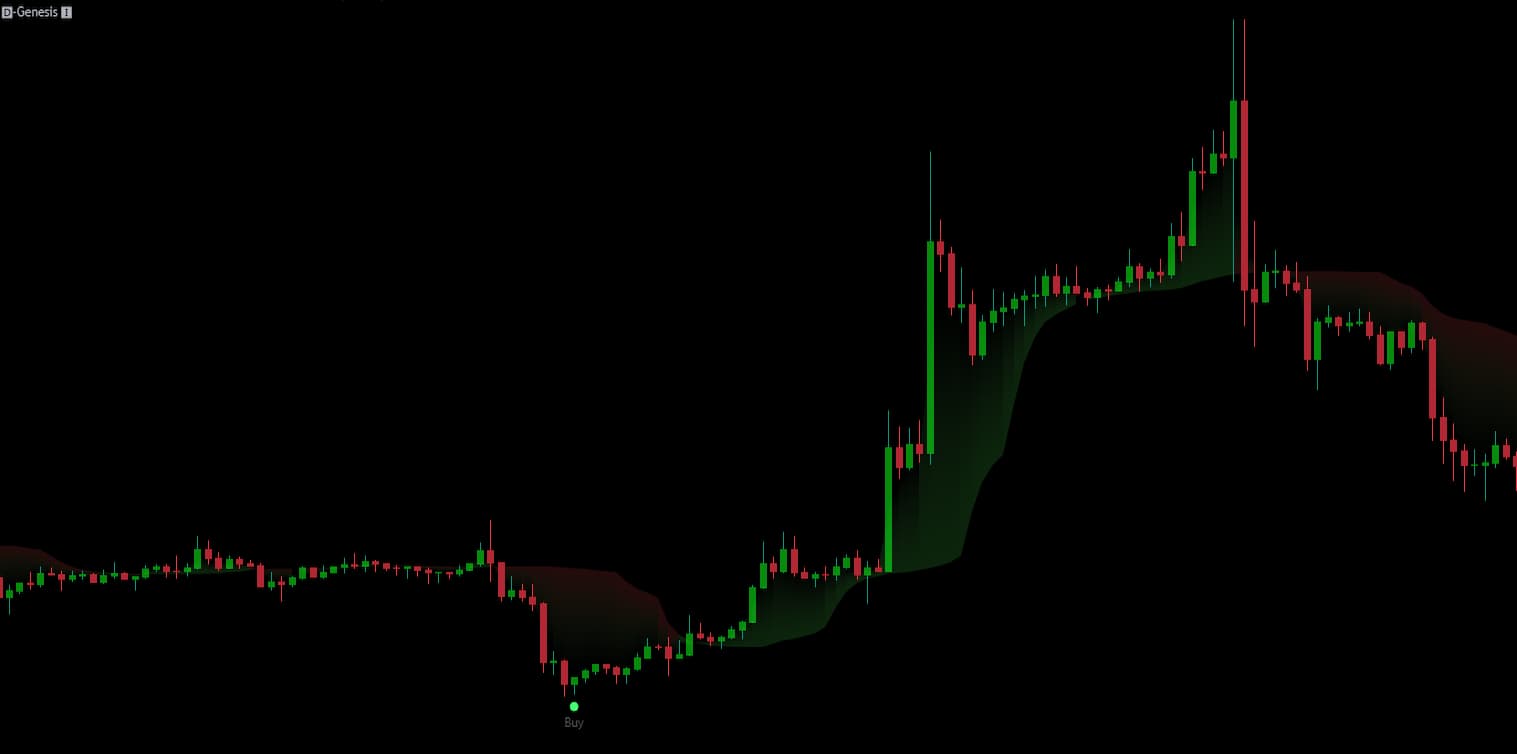
Bot transactions
See how you can install and automate this indicator
Automated Practices
Algorithmic trading is a system that differs from manual trading in many ways, offering a preferred style for those who want to eliminate human psychology from the trading equation or who can't spend much time in front of the screen. Although algorithmic trading may seem appealing and convenient, it carries its own set of risks, including a higher likelihood of liquidation events. Certainly, with this indicator, we aim to provide tailored solutions to these types of problems! We offer you the best way to protect yourself from liquidation and losses!
Manual Trades
In the Manual Trade Panel, the first few lines display values for "Historical correlation with BTC" and "Historical correlation with ETH". These values analyze the linear relationship of the cryptocurrency in the chart with BTC and ETH. This relationship is measured using the Pearson correlation coefficient. If the coefficient is between 0 and 0.3, it indicates a low-level relationship. If it is between 0.3 and 0.7, it signifies a medium-level relationship, and if it is between 0.7 and 1, a high-level relationship. A negative value shows the cryptocurrency has a reverse relationship with BTC or ETH. Also, the background color changes based on the strength of the relationship. For instance, the background will be green in the case of a high-level relationship.

If you want to optimize the correlation value, you can make changes from the "BTCÐ Correlation Lookback Length/Sample Size" section in the "Advanced Dashboard" settings. The standard setting is set at 72.

When calculating correlation, the maximum number of candles depends on your specific needs and goals; there is no fixed number for every situation. You determine the number of candles based on the timeframe (hourly, daily, etc.), the correlation being examined, and the level of analysis detail you need. For the best results, you should run tests by changing the number of candles and evaluate the information obtained from the analysis. This will help you determine the most suitable number of candles for your analysis. On the other hand, it will yield more accurate results if you don't go below a minimum of 50 candles.

When examining "Dynamic Live-Time Correlation with BTC" and "Dynamic Live-Time Correlation with ETH" values, a value of "-1" indicates that the current movement of the cryptocurrency (coin) is less than BTC or ETH. A value of "+1" signifies that the coin's movement is greater than that of BTC or ETH. A value of "0" means that the coin's movement is average compared to the current movement of BTC or ETH.

These two values play an important role in determining trade direction. A coin (-1) that lags behind the BTC and ETH movements dominating the market provides extra confidence when a buy signal is received. Conversely, when dealing with a coin that moves faster than BTC and ETH and receives a sell signal, the idea that retail could occur strengthens. Because prices generally tend to revert to the mean, and BTC and ETH largely determine the market average. With this in mind, these values have been added to our Manual Trading Panel (top right corner of the chart).

The Alpha Volatility Index is calculated using a formula specifically developed for this indicator. Existing volatility measurement tools have been thoroughly reviewed, and a calculation has been made according to the most suitable volatility usage method for manual transactions. You should remember that volatility will be high at the highest and lowest price levels. If you're trading based on the discrepancies between the top and bottom points, you should pay more attention to signals with "medium" level volatility. Because although high volatility is usually seen at the peak and trough areas, if the price is starting a new trend, volatility may stay high for a while. This situation can sometimes lead you to encounter unexpected results and stay in reverse positions in the market.
